![How to check HTML Header in Chrome using Inspect? [Simple Steps]](https://www.csestack.org/wp-content/uploads/2018/05/HTTP-header-in-Chrome-Inspect.png)
In this simple blog post, I will direct you all the steps to check HTML Header in Chrome using Inspect. You will also understand why you should start exploring features provided by Chrome Inspect.
When you enter the URL of the website in the browser, it sends the HTML request to the server. As per the request, the server sends data to your browser. And you can see the complete website loaded in the browser window.
It sounds simple as long as if you are not aware how actually this happens.
HTML request consist of HTML header and body. To get the data from the server, the browser needs to send the special header with different parameters like Request URL, status code, data encoding and data policy… (will see this in another post in detail).
In response to the browser request, the server also sends the HTML header and body consist of actual data.
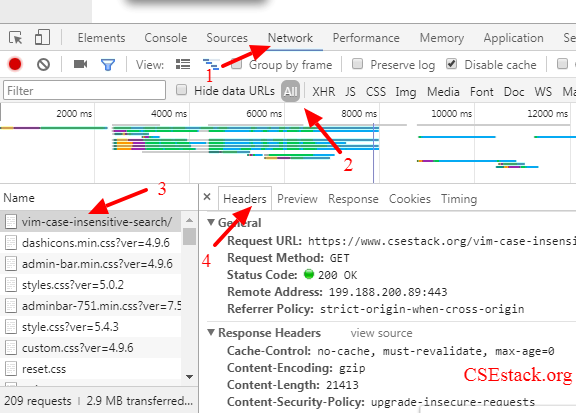
Chrome has a feature called “Inspect” which helps to see the request and response header.
Ctrl+Shift+I to choose Inspect.
f5).You can see all the request and response headers in your Chrome browser.
Likewise, you can also check the Preview of the webpage, received response, cookies and complete waterfall timing for each request.
Related Post: How to Start Building Website in Python?
Inspect is one of the best feature provided by Google Chrome browser. If you are interested in networking or web development, you should start exploring these features.